
Global Broker Regulation Inquiry App
WikiFX
English
简体中文
繁體中文
English
Pусский
日本語
ภาษาไทย
Tiếng Việt
Bahasa Indonesia
Español
हिन्दी
Filippiiniläinen
Français
Deutsch
Português
Türkçe
한국어
العربية

FPG USDCAD Market Report March 18, 2026
Abstract:On the H1 chart, USDCAD initially experienced a strong bullish rally from 1.3575 to 1.3741, highlighting solid short-term buying momentum. After reaching this peak, the pair faced clear price rejectio
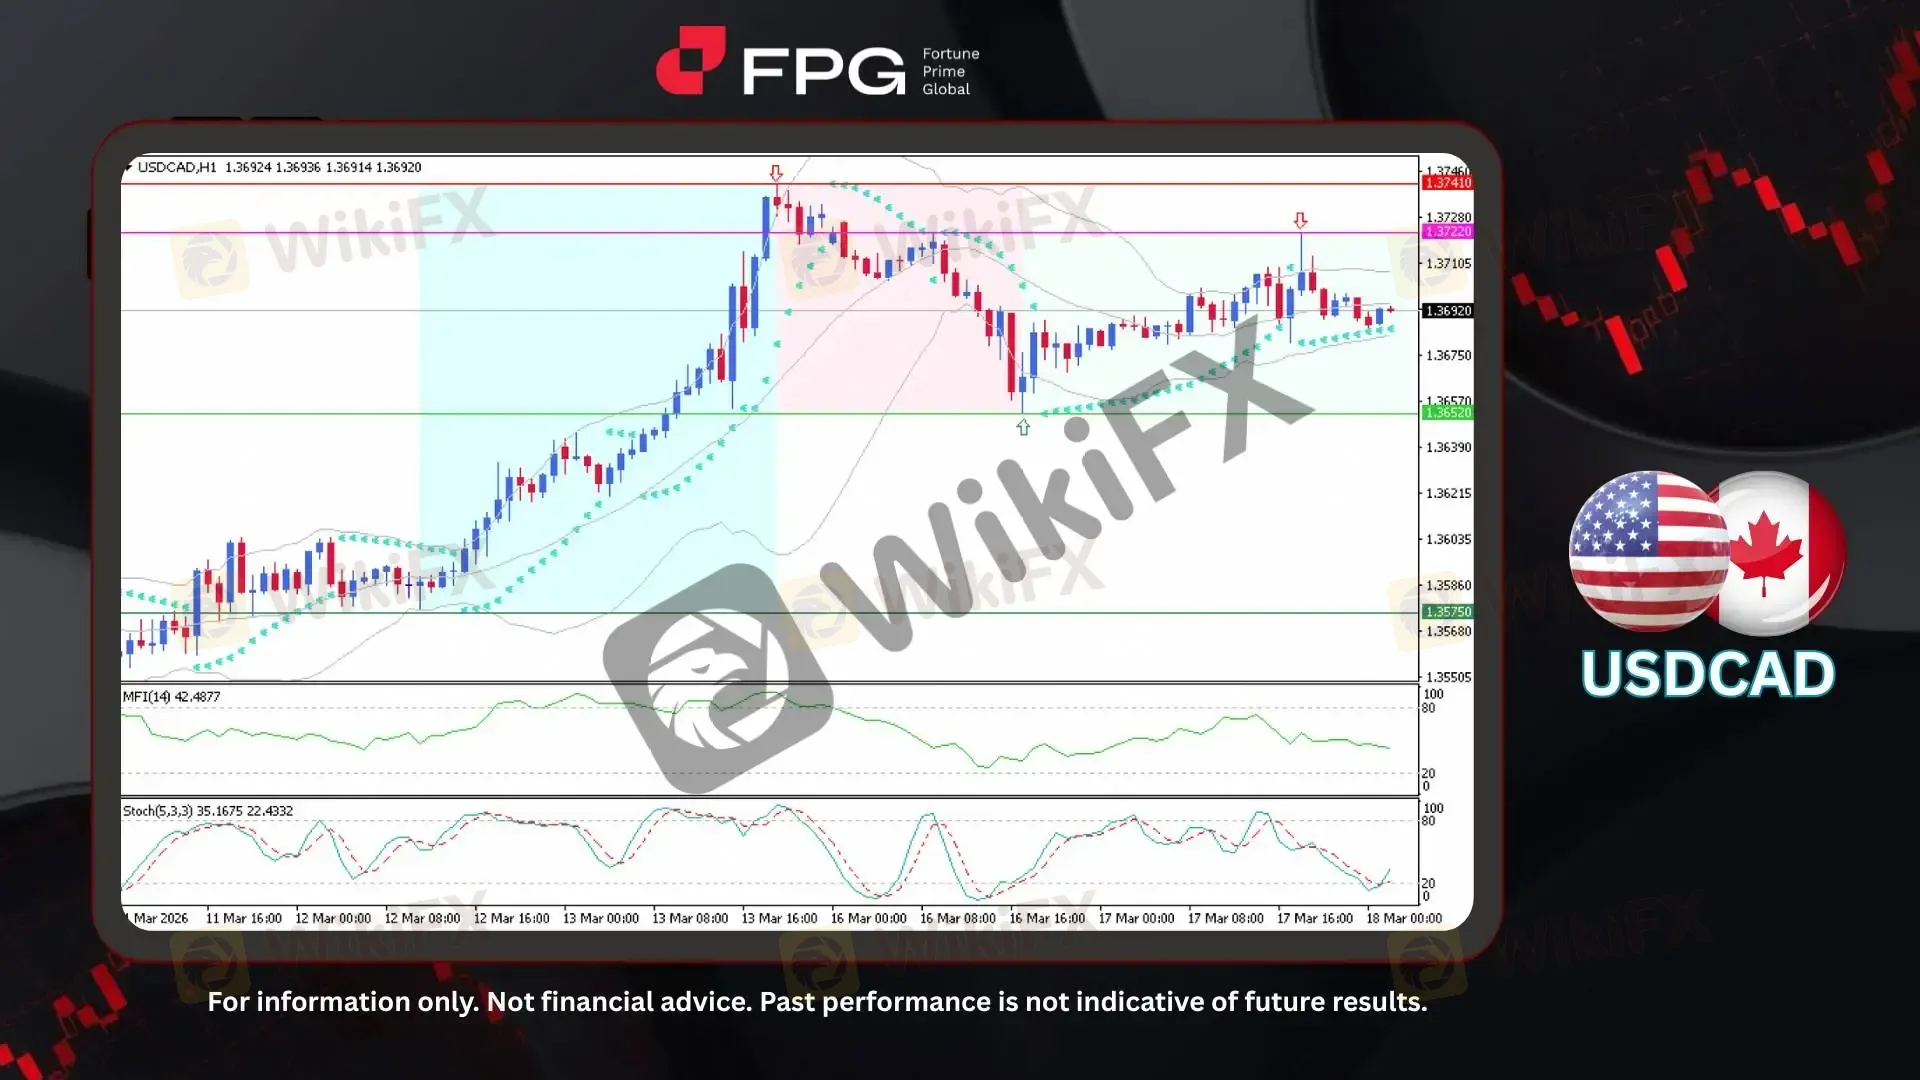
On the H1 chart, USDCAD initially experienced a strong bullish rally from 1.3575 to 1.3741, highlighting solid short-term buying momentum. After reaching this peak, the pair faced clear price rejection, triggering a corrective decline toward 1.3652. Currently, the price is hovering around 1.3692, showing moderate volatility with sideways movement, suggesting the market is entering a consolidation phase following recent sharp swings and directional shifts.
Technical indicators show a mix of short-term caution and a moderate bullish bias. Bollinger Bands are contracting, suggesting decreasing volatility and a potential range-bound phase. The Money Flow Index (MFI) is around 42, indicating neutral money flow without strong buying or selling pressure. Meanwhile, the Stochastic Oscillator is in the 20–40 range and shows a slight upward turn, hinting at potential short-term support and minor bullish attempts, although the overall movement remains largely sideways.
Recent news points to weaknesses in the Canadian economy, including job losses and rising unemployment. Despite these headwinds, USDCAD has remained relatively stable in the short term, reflecting balanced market sentiment. The Canadian dollar receives intermittent support from rising oil prices, while safe-haven demand for the USD occasionally pushes the pair higher. Weak trade data and mixed economic signals have limited sharp price movements, keeping the pair range-bound. Overall, USDCAD continues to exhibit short-term stability amid mixed Canadian economic indicators and steady USD demand.
Technical Market Overview
1. Current Position: Price is trading around 1.3692, consolidating within a sideways range after the rejection from 1.3741.
2. Resistance Zone: Key resistance is seen at 1.3722-1.3741, marking recent highs and strong rejection levels.
3. Support Zone: Immediate support lies at 1.3652, with deeper support near 1.3575.
4. Indicator Observation: Bollinger Bands are contracting, indicating declining volatility and a potential range-bound market. The Money Flow Index (MFI) remains near 42, reflecting neutral market participation without strong directional pressure. The Stochastic Oscillator is in the 20–40 zone and turning slightly upward, suggesting early signs of short-term buying interest.
5. Technical Summary: The market is consolidating after a bullish move, reflecting a temporary pause in momentum. A slight upward bias remains, supported by early signs of buying interest. The next directional move will likely depend on a breakout above resistance or a breakdown below support.
Market Performance:
Forex Last Price % Change
EUR/USD 1.1541 +0.01%
USD/JPY 158.89 −0.05%
Today's Key Economic Calendar:
US: API Crude Oil Stock Change
JP: Balance of Trade
JP: Exports YoY
CN: FDI (YTD) YoY
US: MBA 30-Year Mortgage Rate
US: Core PPI MoM
US: PPI MoM
CA: BoC Interest Decision
US: Factory Orders MoM
CA: BoC Press Conference
US: EIA Crude Oil & Gasoline Stocks Change
Risk Disclaimer: This report is for informational purposes only and does not constitute financial advice. Investments involve risks, and past performance does not guarantee future results. Consult your financial advisor for personalized investment strategies.
Disclaimer:
The views in this article only represent the author's personal views, and do not constitute investment advice on this platform. This platform does not guarantee the accuracy, completeness and timeliness of the information in the article, and will not be liable for any loss caused by the use of or reliance on the information in the article.
WikiFX Broker
Latest News
WikiFX “3·15 Forex Rights Protection Day” Successfully Concludes: Global Exposure of Rogue Brokers
 WikiFX
ACY Securities Review: A Decade-Old Platform or a High-Risk Trap?
WikiFXIs Mazi Finance Legit : A Complete Safety Check for Traders
WikiFXStoneX Challenges Helios with 95p Cash Bid for CAB Payments
WikiFXZentrader Review: Unmasking the Risks of an Unregulated Forex Broker
WikiFXAPMEX Under Scrutiny: Unregulated Operations and Recent Warnings
WikiFXBasics of Foreign Exchange and Currency Pairs in India by Junior Oneii
WikiFXWholesale prices rose 0.7% in February, much more than expected and up 3.4% annually
WikiFXKapitalRS Exposure: Traders Report Withdrawal Issues & Trade Manipulation
WikiFXOil Prices Climb as Geopolitical Tensions Spotlight Strait of Hormuz Risks
WikiFXCurrency Calculator
USD

CNY
Current Rate:0
Amount
USD
Available
CNY
Calculate 