

عالمی بروکر ریگولیشن چیک کرنے والا ایپ
WikiFX
اردو
简体中文
繁體中文
English
Pусский
日本語
ภาษาไทย
Tiếng Việt
Bahasa Indonesia
Español
हिन्दी
Filippiiniläinen
Français
Deutsch
Português
Türkçe
한국어
العربية
اردو
FPG USOUSD Market Report April 29, 2026
خلاصہ۔:On the H1 timeframe chart, USOUSD has successfully climbed back above 100, following a breakout, briefly reaching 103.60, with the current price trading around 101.10. As observed on the chart, a shar
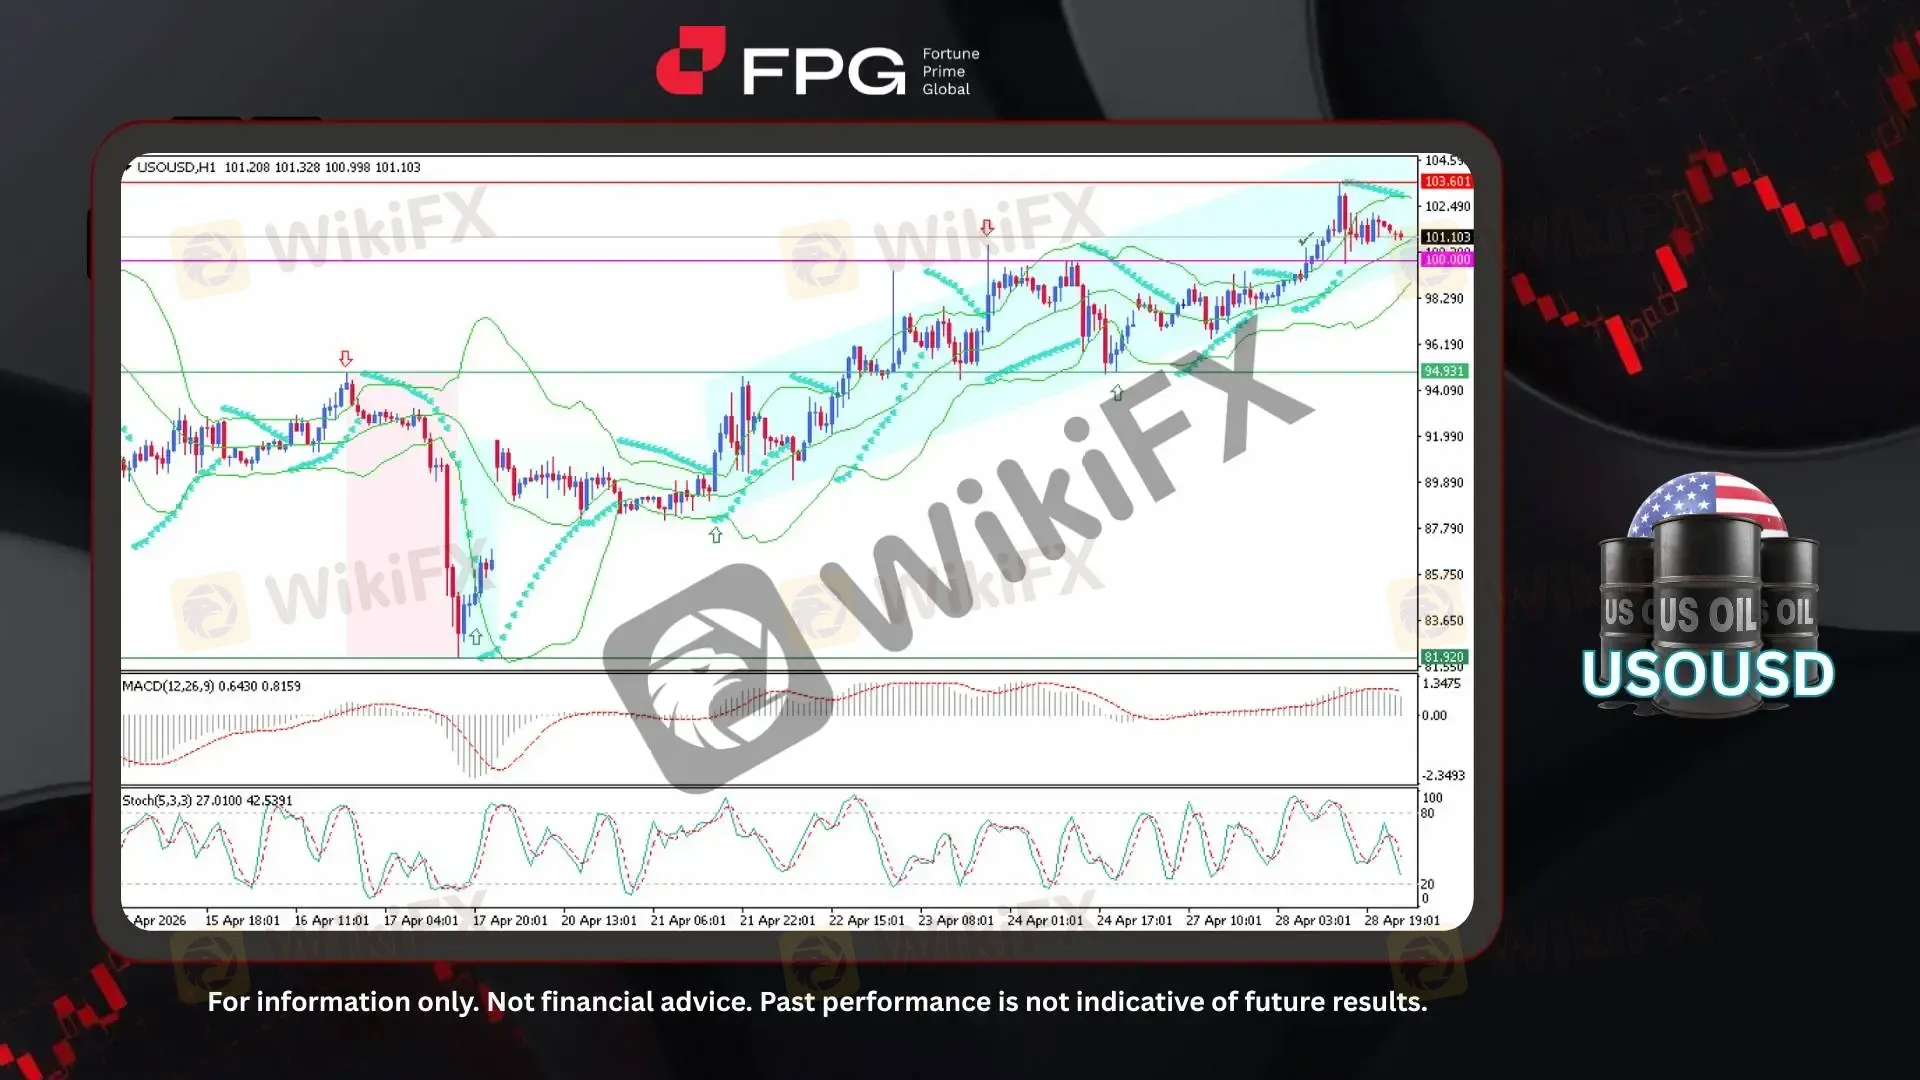
On the H1 timeframe chart, USOUSD has successfully climbed back above 100, following a breakout, briefly reaching 103.60, with the current price trading around 101.10. As observed on the chart, a sharp price drop occurred in the middle of this month, falling from 94.93 to 81.92. However, this was followed by a strong and rapid bounce-back correction. After a short period of consolidation, the market resumed a steady bullish rally that continues up to today. This bullish movement has formed a clearly defined ascending channel.
The Bollinger Bands show price currently moving in the upper-mid zone after an expansion phase, suggesting prior strong momentum is now entering a consolidation stage rather than a full reversal. MACD remains above the zero line, indicating the broader bullish momentum is still intact, although the histogram shows signs of weakening bullish strength and potential short-term flattening. Meanwhile, the Stochastic oscillator has pulled down from overbought territory toward the mid-zone, signaling a temporary corrective phase or mild retracement within the ongoing uptrend rather than a trend shift.
Recent developments indicate that global oil markets are being reshaped by structural shifts and geopolitical tensions, including potential changes within OPEC+ that could disrupt supply coordination and affect pricing. At the same time, tensions in the Middle East have tightened supply expectations and pushed crude prices higher, increasing inflation risks and weighing on global growth. In the U.S., uncertainty surrounding inflation, tariffs, and interest rates continues to drive market volatility, while policymakers warn of broader economic instability stemming from energy shocks. Overall, oil prices remain in a bullish trend, but traders should stay alert to economic data and policy updates that may directly influence price movements.
Technical Market Overview
1. Current Position: Price is trading around 101.10 and remains above the key psychological level of 100 after a strong breakout. The market structure is still moving within a clear ascending channel, showing that the broader uptrend remains intact even though momentum has started to slow.
2. Resistance Zone: The nearest resistance sits in the 102.50 to 103.60 area, which marks the recent rejection zone. If price is able to break and hold above 103.60, it could extend further toward the 104.50 region.
3. Support Zone: Immediate support is located around 100.00, acting as a psychological and structural level. Below that, the next support stands at 94.93.
4. Indicator Observation: Bollinger Bands show price holding in the upper-middle area following a prior expansion, suggesting consolidation rather than reversal. MACD remains above the zero line, confirming bullish momentum is still present, although the histogram indicates weakening strength. The Stochastic oscillator has moved down from overbought levels toward the mid-range, pointing to a short-term corrective phase.
5. Technical Summary: The overall trend remains bullish, supported by the consistent formation of higher highs and higher lows. However, the market appears to be entering a consolidation or mild retracement phase after the recent rally. As long as price stays above 100, the bullish bias remains valid, with pullbacks likely to be corrective. A drop below 98 would signal a deeper correction, while a breakout above 103.60 would reinforce continuation of the upward trend.
Market Performance:
Commodities Last Price % Change
UKOUSD 110.37 +2.00%
Today's Key Economic Calendar:
EU: ECB President Lagarde Speech
CN: National Peoples Congress Standing Committee
AU: Inflation Rate MoM & YoY
AU: RBA Trimmed Mean CPI MoM & YoY
JP: Housing Starts YoY
EU: Economic Sentiment
US: MBA 30-Year Mortgage Rate
US: Building Permits MoM & Preliminary
US: Durable Goods Orders & Ex Transp MoM
US: Goods Trades Balance Adv
US: Housing Starts
US: Retail Inventories Ex Autos & Wholesale Inventories MoM Adv
CA: BoC Interest Rate Decision
CA: BoC Monetary Policy Report
CA: BoC Press Conference
US: EIA Crude Oil & Gasoline Stocks Change
Risk Disclaimer: This report is for informational purposes only and does not constitute financial advice. Investments involve risks, and past performance does not guarantee future results. Consult your financial advisor for personalized investment strategies.
ڈس کلیمر:
یہ مضمون صرف مصنف کی ذاتی رائے پر مبنی ہے، یہ پلیٹ فارم کی سرمایہ کاری کی مشورہ نہیں ہے۔ پلیٹ فارم مضمون کی معلومات کی درستگی، مکملیت اور بروقت ہونے کی کوئی ضمانت نہیں دیتا، اور مضمون کی معلومات پر اعتماد یا استعمال سے ہونے والے کسی بھی نقصان کی ذمہ داری قبول نہیں کرتا۔
WIKIFX بروکر
ایکسچینج ریٹ کا حساب
USD

CNY
موجودہ ایکسچینج ریٹ:0
براہ کرم رقم درج کریں۔
USD
تبادلہ کے قابل رقم
CNY
حساب شروع کریں 